Laboratory of Ocean Ecosystem Dynamics
日本語
Tokyo University of Marine Science and Technology

Eiji Masunaga (Postdoctoral Researcher)
Ph.D., The Graduate School of Marine Science and Technology, 2015
M.S., The Graduate School of Marine Science and Technology, 2012
B.S., Tokyo University of Marine Science and Technology, 2010
Introduction
On this page, we will introduce our research focusing on coastal areas. In the follow sections, we introduce (1) a new tow-yo instrument to observe coastal areas in high spatial resolution, (2) shoaling internal waves propagating along slopes and (3) numerical simulations using SUNTANS.
1. Developing A New Instrument for Coastal Areas

Fig. 1. YODA Profiler (a) and winch (b)
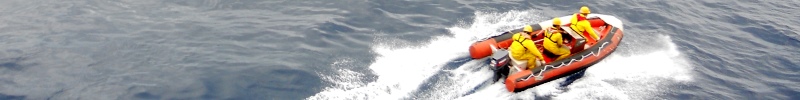
Topography effects generate complicated flow and internal wave structures in shallow coastal areas, and these phenomena greatly influence biological production and mass transport in the ocean. However, ocean dynamics in coastal areas have not been well understood, due to the lack of suitable instrument to observe these minute structures directly. To address this issue, we have developed a new tow-yo instrument, Yoing Ocean Data Acquisition Profiler (YODA Profiler, Masunaga and Yamazaki 2013, Fig. 1), to observe the coastal ocean in high spatial and temporal resolution. Inspired by free-fall microstructure profilers, a brush is mounted at the top of the sensor. Since the YODA Profiler is very small, this instrument allows us to observe the oceanic structure from small fishing boats with limited space. The sensor carries temperature, conductivity, pressure, fluorescence, turbidity and RINKO oxygen sensors.
The superior performance of the YODA Profiler is clearly shown when comparing the high resolution data from the profiler with the low resolution data made by sub-sampling from the high resolution data (Fig. 2). The new high resolution data shows small-scale internal waves and patchy and wave-like distribution of phytoplankton under the river plume. In addition, we developed a new statistical method to estimate the turbulent kinetic energy dissipation rate, ε, from the conductivity gradient obtained by the YODA Profiler. ε from the YODA Profiler indicates the strong turbulent mixing in the river plume and sub-surface layer (around 5 m, Fig. 3). These two strong mixing areas could be generated by the shear instability and the breaking of internal waves. The patchy phytoplankton distribution is located in this wavy and turbulent sub-surface layer; this feature may indicate that internal waves and turbulent mixing can influence phytoplankton distribution on scales smaller than previously thought. More details about the YODA Profiler and the observed results are described in Masunaga and Yamazaki 2013.
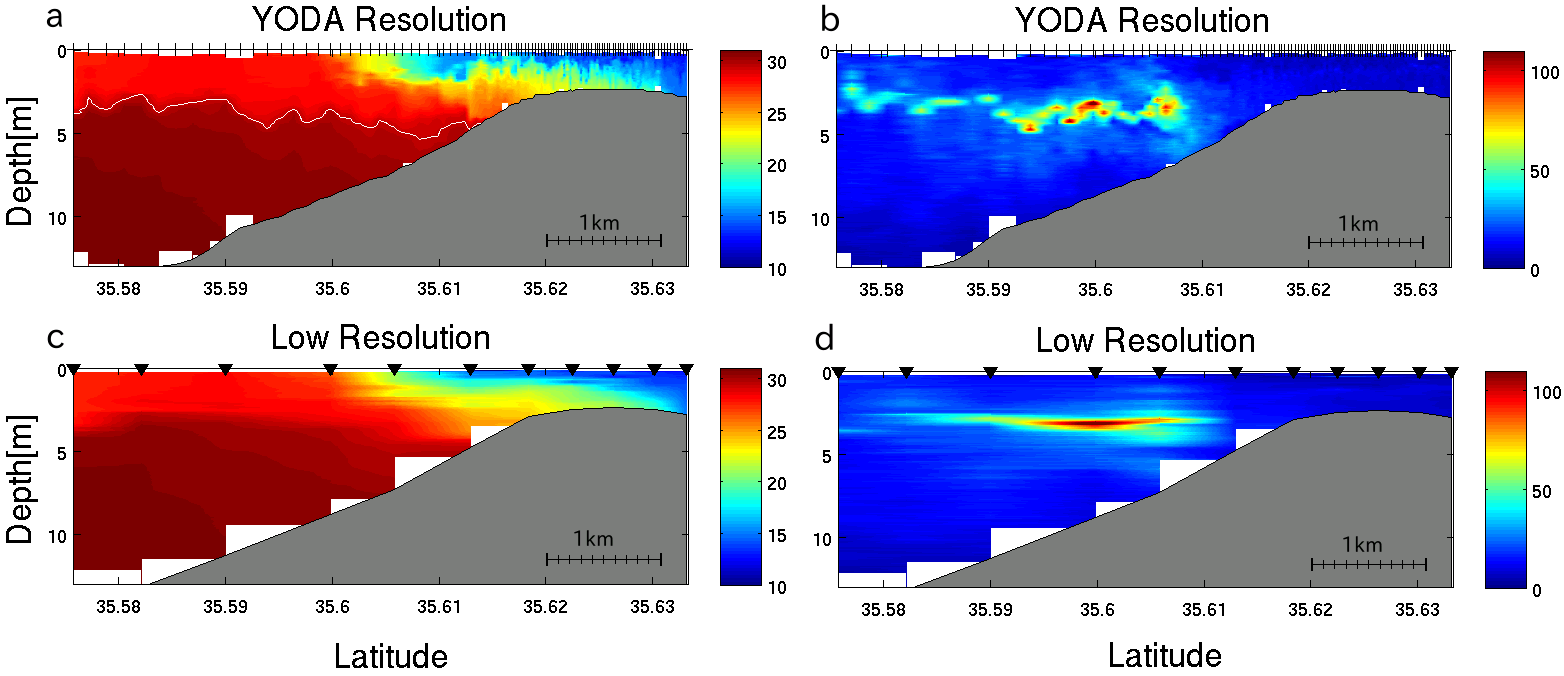
Fig. 2. An example of the result from the YODA Profiler observation conducted around the mouth of the Arakawa River in Tokyo Bay, Japan ((a) salinity, (b) fluorescence). Lower panels represent low-resolution data made by sub-sampling. The horizontal resolution of the low resolution data is equivalent to conventional CTD surveys conducted by previous studies in the same area.
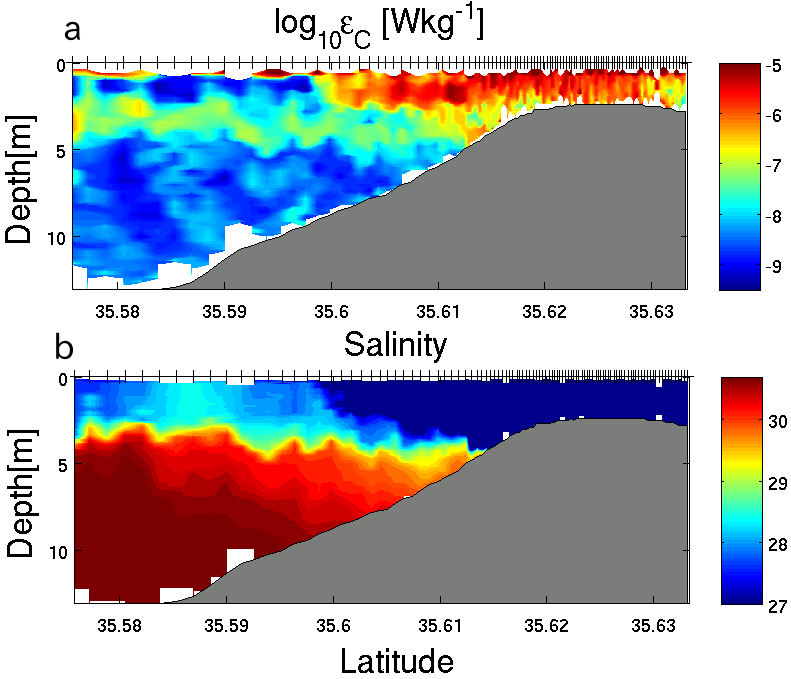
Fig. 3. The rate of turbulent kinetic energy dissipation (a) and salinity (b) during the same period as shown in Fig. 2. Salinity data is the same as shown in Fig. 2, but the color range is changed to high light the sub-surface layer (3 – 7m).
2. Shoaling Internal Waves (Bore Waves) Propagating Along The Slope
2.1 Observations in Otsuchi Bay
The YODA Profiler allowed us to observe coastal ocean structures, so as the second topic, we will introduce some observation results obtained by the YODA Profiler and mooring surveys.
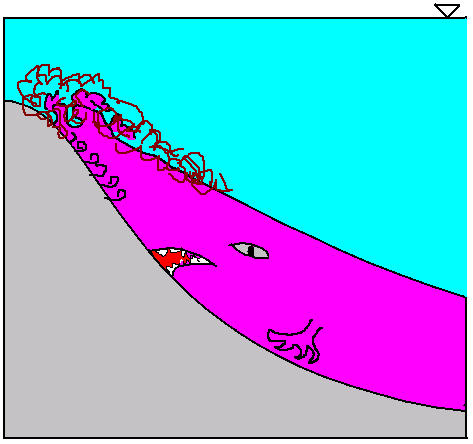
Fig. 4. Image depicting an internal bore wave propagating along the slope.
The internal wave is the one of the many energetic phenomena in the ocean. Especially in the coastal areas, highly non-linear internal waves propagating into shallow areas have high energy levels similar to tsunami. These waves contribute to mass transport and mixing the water in the ocean (e.g. Cacchione et al. 2002, McPhee-Shaw et al. 2004). The amplitude of the internal waves reaches up to 100 m in coastal areas, and the frequency is dominated by semidiurnal tide (lunar cycle), diurnal tide or the earth’s rotational effect. Lateral offshore mass fluxes (e.g. sediments, nutrients, iron) due to internal waves are much greater than those caused by vertical settlings from the ocean surface (Van Weering et al. 2001, McPhee-Shaw et al. 2004 & 2006). Therefore, the mass transport induced by internal waves is important for ocean biological production.
In order to reveal behaviors of internal waves along the slopes, we conducted several observations in Otsuchi Bay and Tokyo Bay using the YODA Profiler, a thermistor array and an ADCP.
We observed the internal bore wave propagating along the slope in Otsuchi Bay (Fig. 5, Fig. 6). The height of the bore wave reached 20 m at our observation site. Strong sediment resuspension was observed at the head of the bore wave (Fig. 7). Results from the thermistor array indicate that the frequency of the bore wave in Otsuchi Bay seems to be dominated by the semidiurnal tidal frequency. However, incursions of cold bore waves are intermittent, and no significant frequency could be determined could be determined. This intermittent feature may be due to the variable propagation speeds of internal waves caused by the stratification condition.

Fig. 5. Temperature distributions observed before the bore wave period (a) and during the bore wave period (b) from the YODA Profiler. (c) shows the sea surface height on September 27, 2012. Tick marks on panels (a) and (b) indicate profiling points.
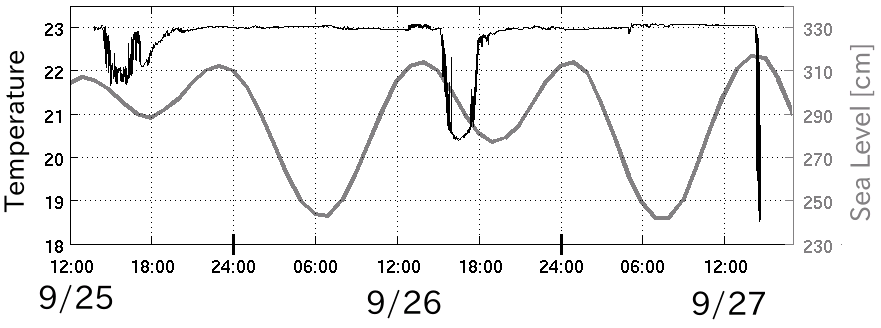
Fig. 6. Temperature (thin black line) and sea surface height (thick grey line, Ofunato, JMA).
Turbidity distributions show the strong sediment resuspension at the head of the bore wave (Fig. 7). Suspended sediments intrude into the offshore water column above the thermocline. This turbidity layer is called an “intermediate nepheloid layer (INL)”. INLs are frequently observed in continental shelves. Strong turbulent mixing was observed at the head of the bore wave, reaching 10-6 Wkg-1.
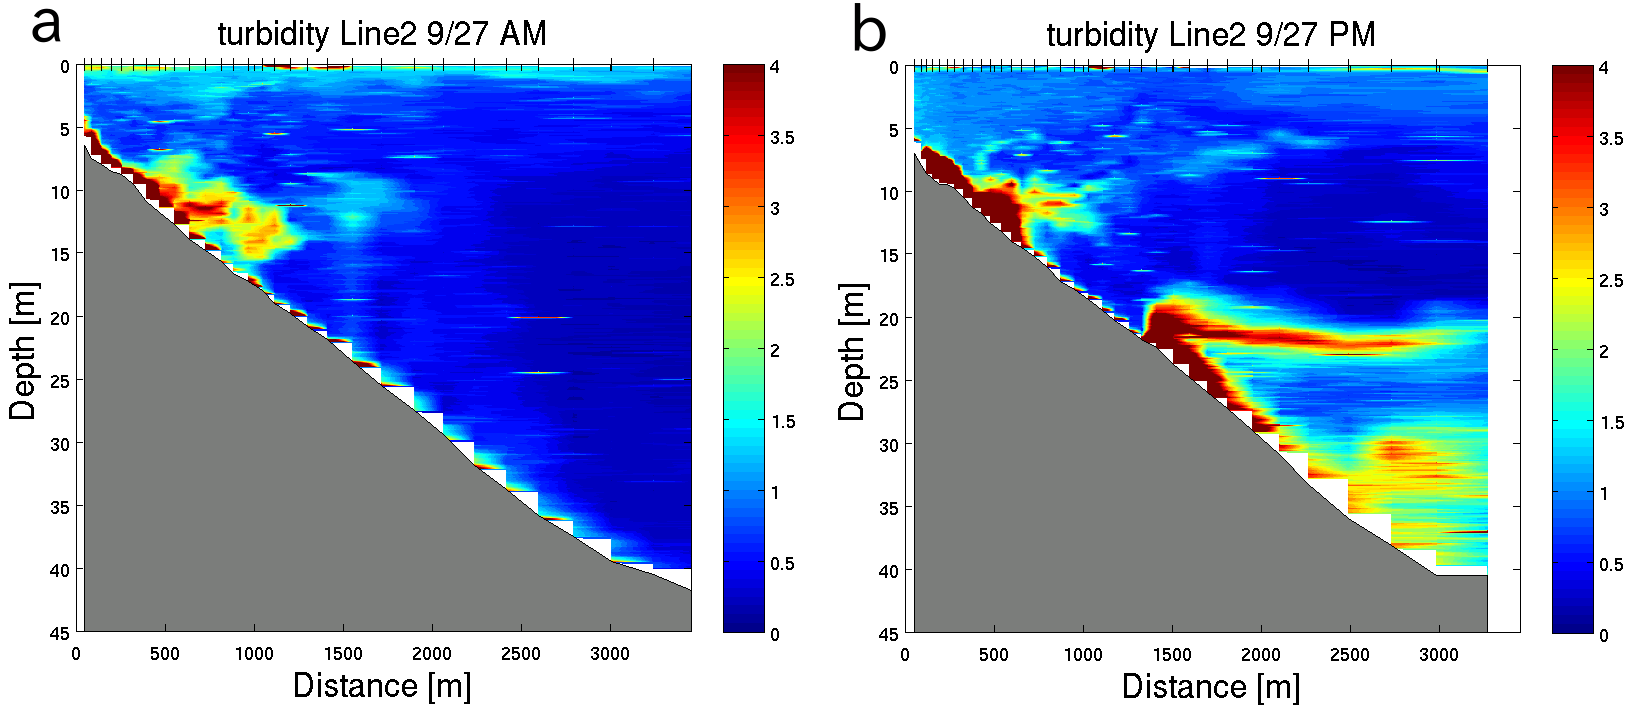
Fig. 7. Turbidity [FTU] distributions observed before the bore wave period (a) and during the bore wave period (b) by the YODA Profiler on September 27, 2012.
The high resolved thermistor chain shows the shear instability-like feature and high frequency waves during the bore wave periods (Fig. 8). The close up figure of the head of the bore wave shows a large and sharp isothermal displacement accompanied by a vortex-like structure (Fig. 8c). The frequency of the high frequency waves is near the local buoyancy frequency; these waves may result from shear instability (see Antenucci and Imberger 2001, Boegman et al. 2003).
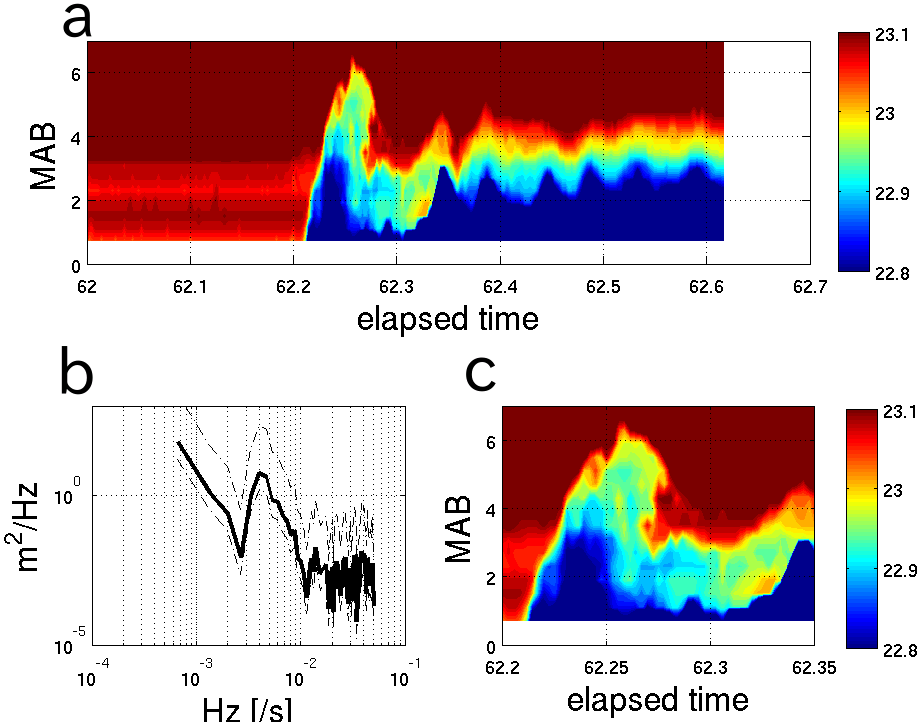
Fig. 8. Temperature (a, c) and the spectra (b) of the isothermal depth fluctuation in the wave on September 27, 2012. (c) shows the close up of the head of the wave.
Observed current data shows the shoreward current along the slope and the strong vertical current at the beginning of the bore wave period (Fig. 9, Time = 62.1). These shoreward (sweep) and vertical (ejection) flows indicate a vortex-like current at the head of the bore wave as shown in Fig. 9e. Moreover, backscatter intensity from the ADCP shows strong sediment resuspension, and the suspended sediments reach 8 m above the bottom along the vortex (Fig. 9c). After the burst-like resuspension, a high-frequency wave structure, accompanied by resuspension and strong vertical flow, also appeared near the bottom (Fig. 9, Time = 62.2 – 62.5).
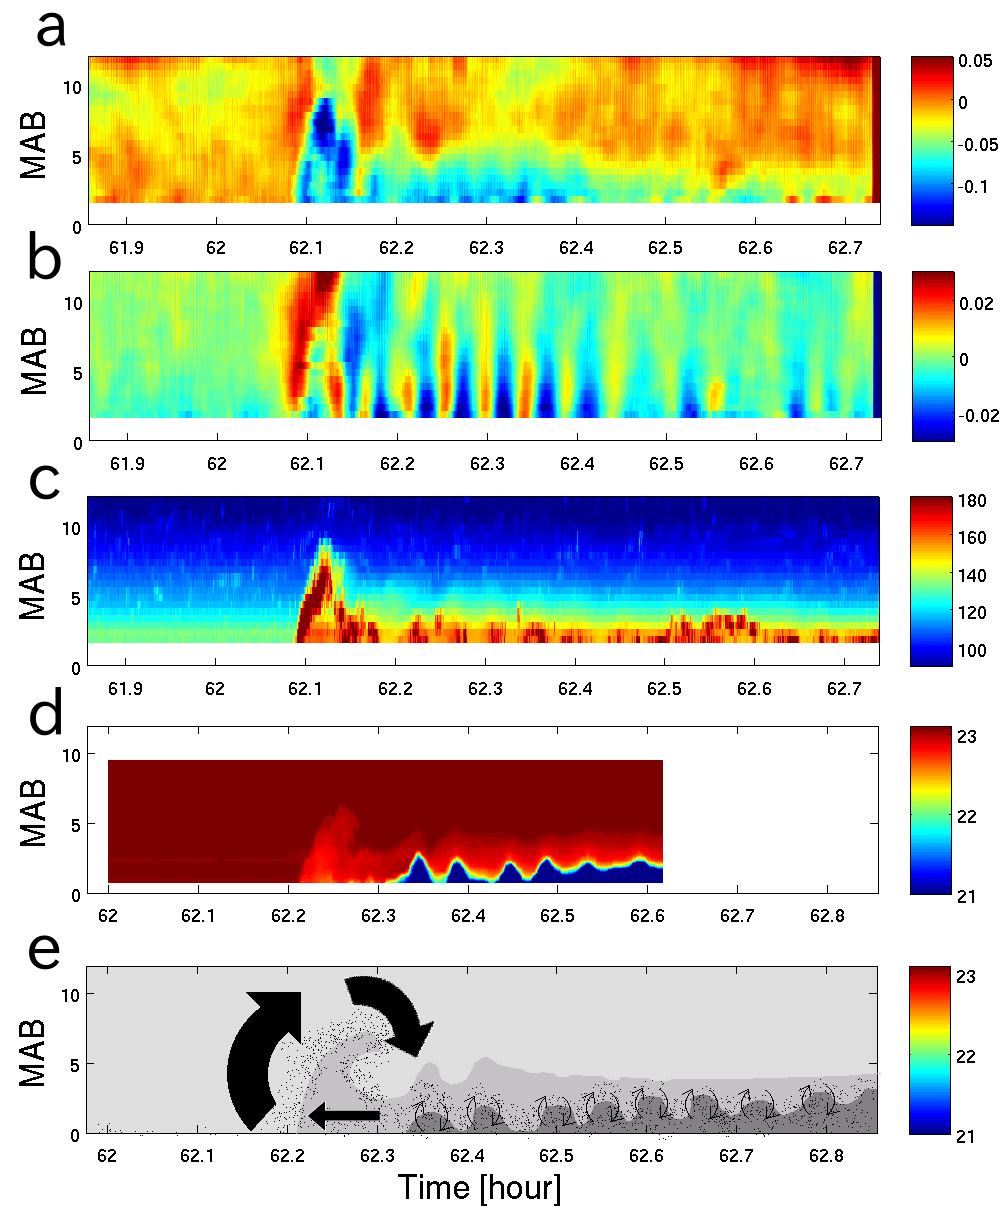
Fig. 9. Time series data from the ADCP (a, b, c, d) and the thermistor array (e). (a) The east west current component [ms-1], (b) the vertical current [ms-1], (c) the echo intensity, (d) temperature, and (e) a schematic image of the vortex flow.
The internal tide travels at angle
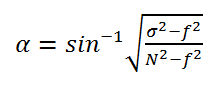
where σ is the semidiurnal tidal frequency, f is the local inertial frequency, and N is the buoyancy frequency. The local inertial frequency is expressed as 2 Ω sinφ, where Ω is the Earth’s rotational vector, and φ is the latitude. The direction of the ray of internal waves after the reflection on the slope is determined by a relationship between the ray angle α and the slope angle β. When the ray angle is larger than the slope angle (α > β), the wave can propagate into the shallow area after the reflection. When the ray angle is smaller than the slope angle (α < β), the wave reflects and goes offshore and cannot propagate into the shallow area after the reflection.
When α = β (the critical angle condition), the strong energy convergence occurs along the slope. The slope angle of the study area is approximately 0.6 degrees, and the incident wave beam angle is 0.5-1 degrees in the internal bore wave. This is near the critical condition, and the internal wave can travel into the shallow area. In this condition, the energy of the internal wave is trapped between the thermocline (the interface of the internal wave) and the sloping bottom, and strong energy convergence occurs at the head of the wave, as shown in Thorpe (1998) and Cacchione et al. (2002). Thus, internal wave reflections in the critical condition enhance the shoreward horizontal flow along the slope and the bore wave. Consequently, the enhanced horizontal flow generates the vertical ejection flow and the vortex structure at the head of the bore wave (Fig. 9e, Fig. 10).
The schematic image below (Fig. 10) depicts physical processes in Otsuchi Bay. In addition, our research pointed out that surface gravity wave also contribute to sediment resuspension in the bay and river outflow carries high-turbidity water from the river to the head of the bay.
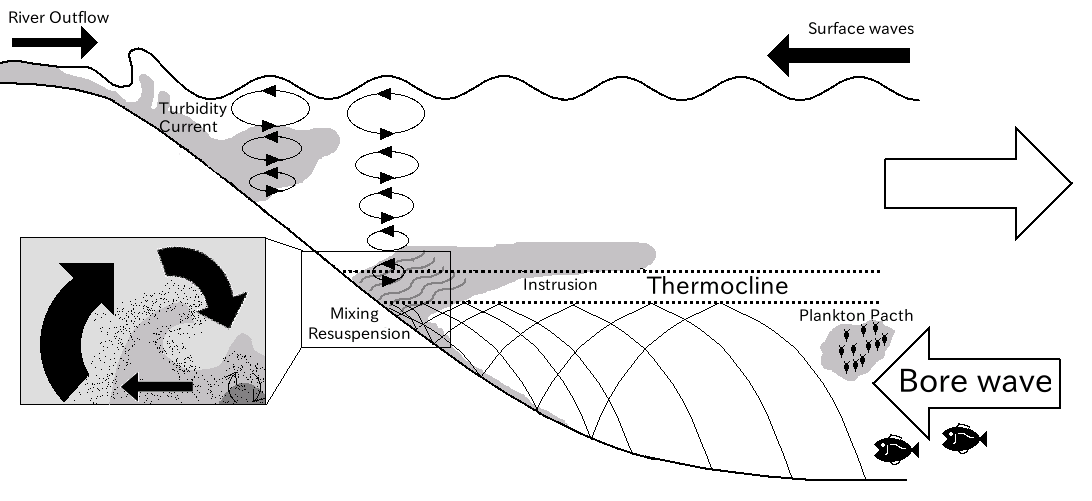
Fig. 10. A schematic image of physical processes in Otsuchi Bay.
2.2 Observations in The Arakawa River Mouth
As we mentioned before, internal waves induce strong currents and sediment resuspension along the slope. The vortex structure is a lesser-studied phenomena in the ocean, because the vortex is too small to observe by using a conventional CTD. Recent studies have shown such vortex structures by using high-resolution numerical models (Vlasenko and Hutter 2002, Venayagamoorthy and Fringer 2006) and high-resolution mooring arrays (Van Halen 2009, our study also). However, no previous study has presented a spatial structure of the vortex induced by internal waves.
The YODA Profiler allows us to observe such small-scale structures. We succeeded in observing the vortex structure along the slope in the Arakawa River mouth when internal wave beam angles satisfied the critical angle condition (Fig. 11). The turbulent energy dissipation rate was high in the vortex, reaching 3×10⁻⁶ Wkg-1 (Fig. 11b). The turbidity distribution showed strong sediment resuspension along the slope and suspended sediments following the ring of the vortex (Fig. 12a). The rotor structure was also associated with low dissolved oxygen water that appeared to be moving toward shallow area (Fig. 12b). The vertical turbulent diffusivity was high around the vortex. The diffusivity reached 3×10⁻⁴ m2s-1 (Fig. 12c). The vortex and breaking of internal waves contributed to the vertical mixing in the river mouth, meaning they are important factors in the diffusive processes between the bay water and the low salinity water from the river.
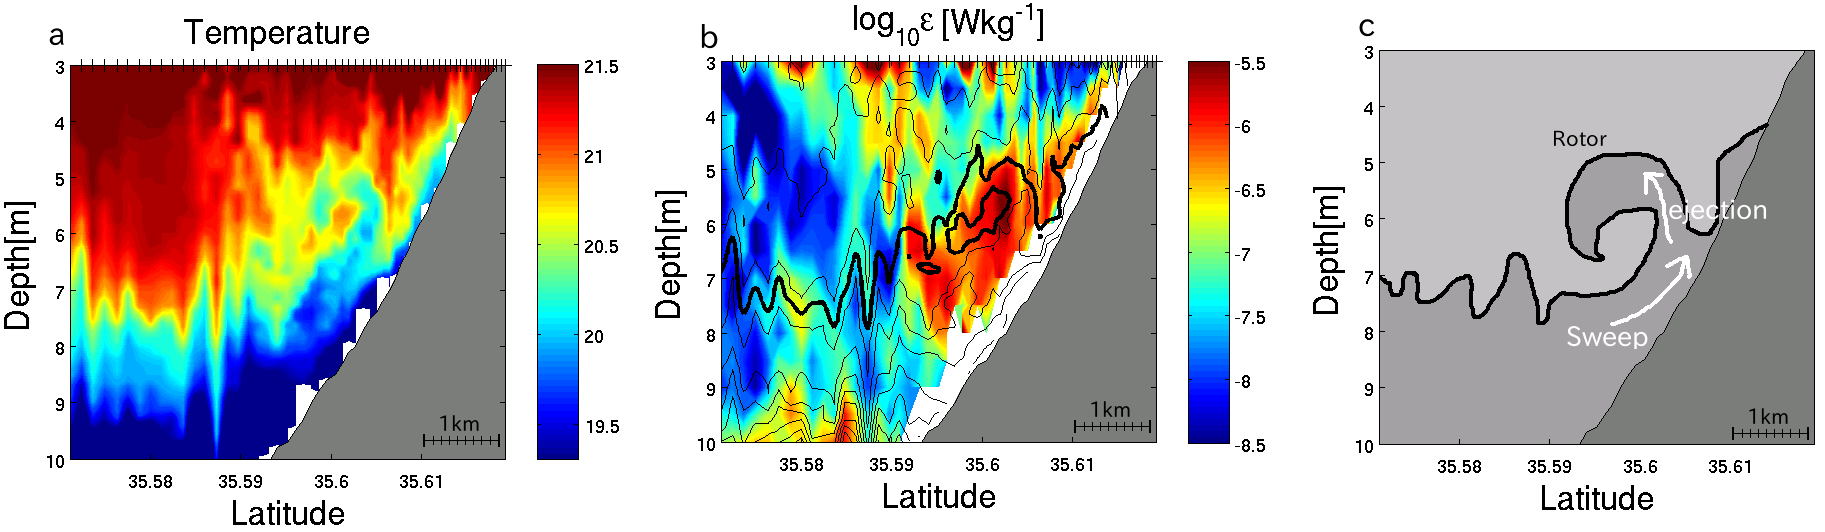
Fig. 11. Temperature (a), ε [Wkg-1] (b) distributions and a schematic image of the rotor wave (c) on June 1, 2012. The black lines in (b) indicate isothermal lines.
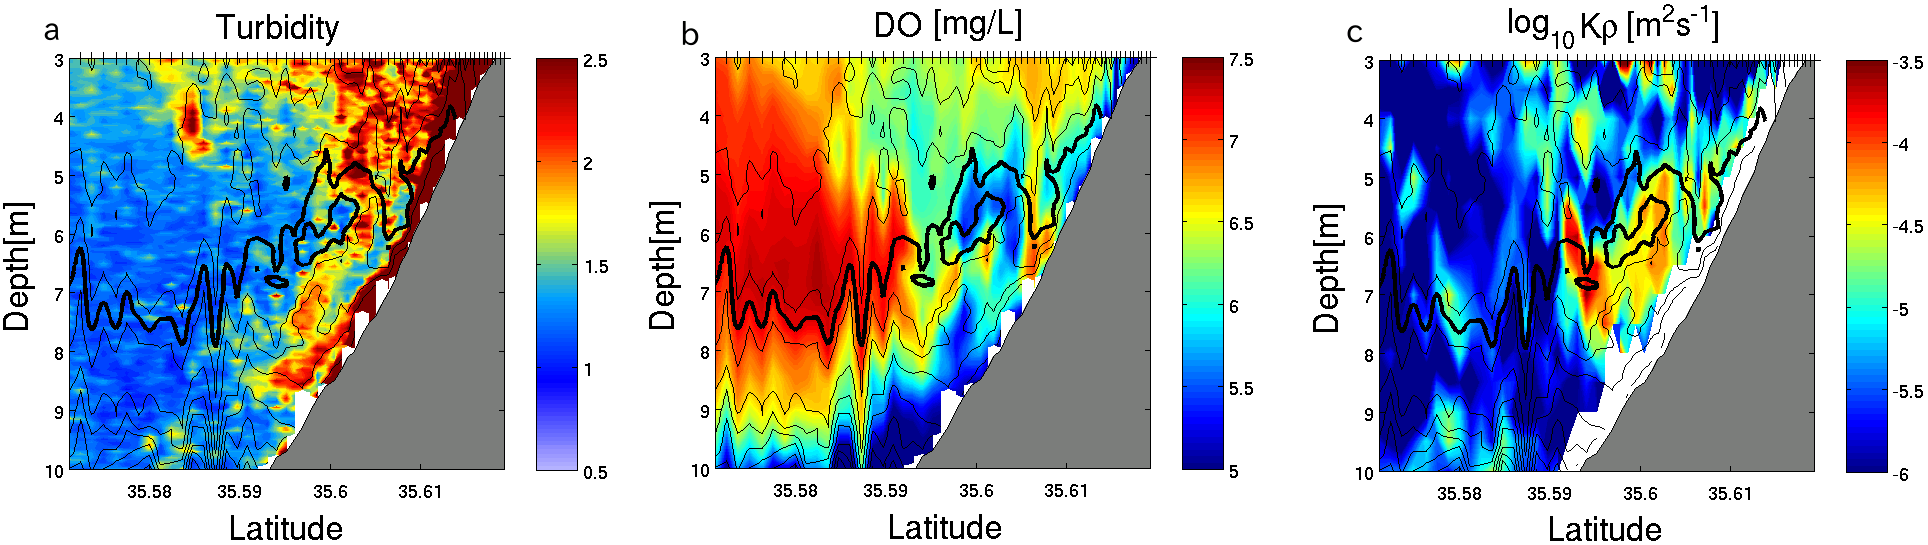
Fig. 12. Turbidity [FTU] (a), dissolved oxygen [mgL-1] (b) and Kρ [m2s-1] (c) distributions on June 1, 2012. The black lines indicate isothermal lines.
3. Numerical Simulations Using SUNTANS
To investigate internal waves propagating along the slope in more detail, we used the Stanford Unstructured Nonhydrostatic Terrain-following Adaptive Navier-Stokes Simulator (SUNTANS, Fringer et al. 2006).
Results from the Otsuchi Bay simulations performed with SUNTANS show internal bore waves and good agreement with in-situ observation data. The ocean boundary is forced by the semidiurnal 1st mode internal wave. The steep isothermal depth displacement in the middle of Fig. 13 represents the head of the bore wave and the vortex structure. The vortex structure produced by employing finer resolution is shown in Fig. 15.
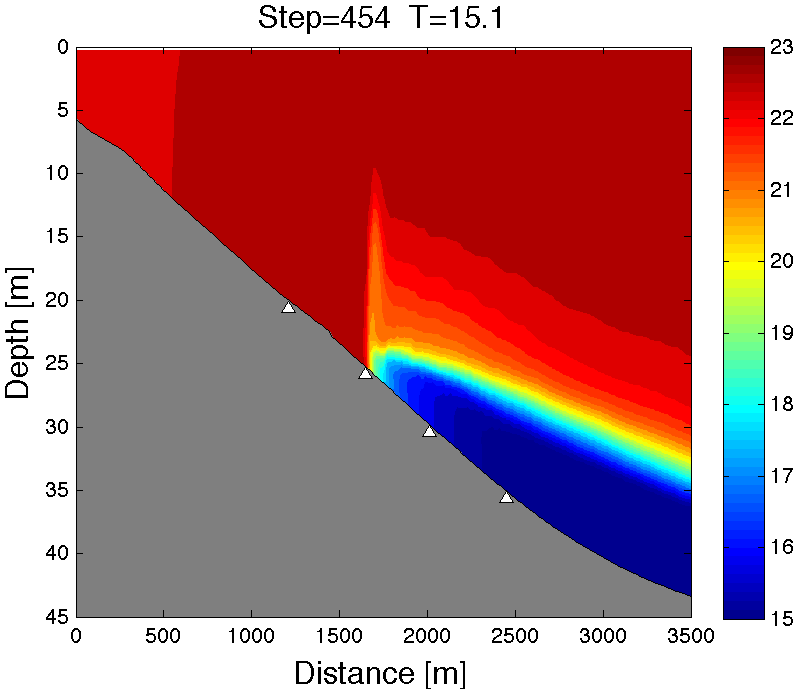
Fig. 13. The temperature distribution from SUNTANS in the bore wave period.
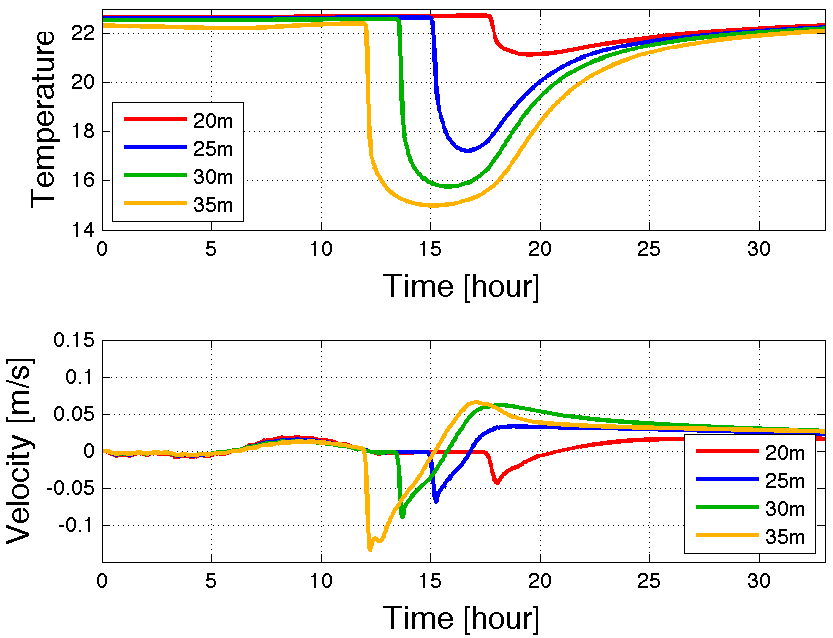
Fig. 14. Temperature and velocity time series on the bottom at 20 m, 25 m, 30 m and 35 m depth sites.

Fig. 15. The vortex structure produced by SUNTANS at the head of the bore wave.
Animations by SUNTANS
Particle tracking 1 (3.1MB)
Particle tracking 2 (6.6MB)