

Research Approach
Subprogram Overview
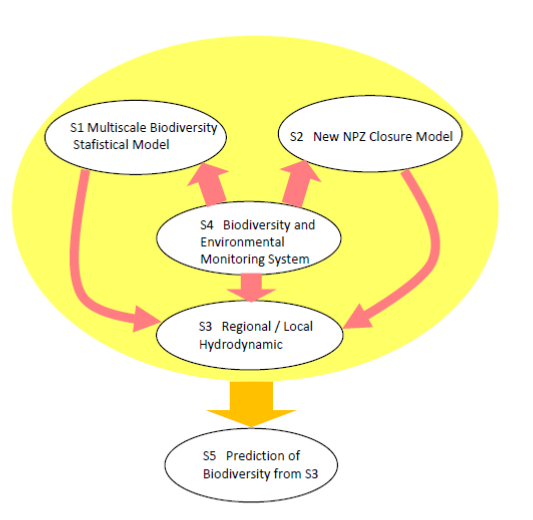
We have divided our project into the following 5 subprograms to accomplish our goal.
- S1. Multi-scale biodiversity model
- S2. New planktonic ecosystem model
- S3. High resolution 3-dimensional hydrodynamic model
- S4. Biodiversity and environmental underwater monitoring system
- S5. Prediction of biodiversity from S3
Figure 1 illustrates our project concept.
The system in S4 will be used to improve the models in S1, S2 and S3, and eventually, S1 and S2 (i.e. biological models) will be inserted into S3 (i.e. hydrodynamic model) to accomplish S5 (i.e. prediction of biodiversity).
S1. Multi-scale biodiversity model
We propose to use the Probability of Interspecific Encounter (PIE) as the ecologically meaningful measure of species diversity (Hurlbert 1971).
Specifically,
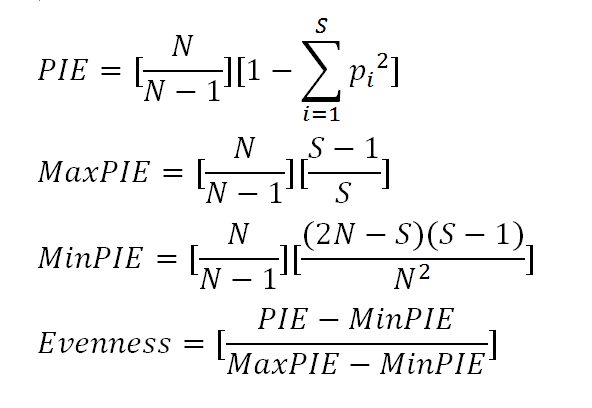
where N is total biomass, pi is the proportion of size i relative to N, and S is the total number of size class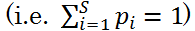 .
.
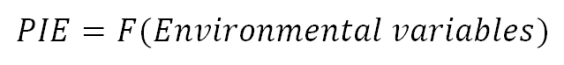
Our hypothesis is that PIE will be a function of environmental variables such as temperature, salinity, DO (dissolved oxygen), Chl.a, nutrients and light.
Specifically,
S2. New planktonic ecosystem model
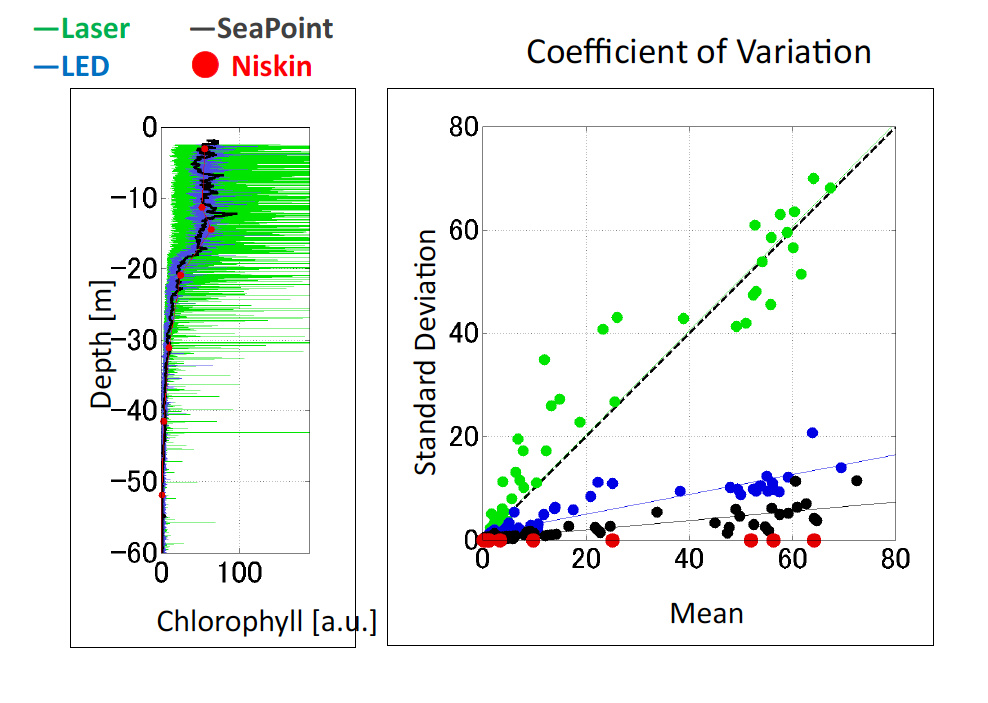
Since our observed Chl.a data are highly intermittent (Figure 2), this Chl.a data should be treated as a sum of mean and fluctuating component. We will decompose Chl.a into mean <Chl.a> and fluctuating components .
.
Following this observed fact, we propose to develop a new NPZ model for mean and fluctuating component. Hence, we decompose each variable as follows:
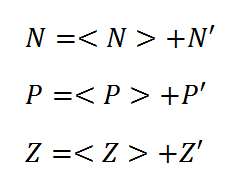
where N indicates nutrients, P indicates phytoplankton and Z indicates zooplankton.
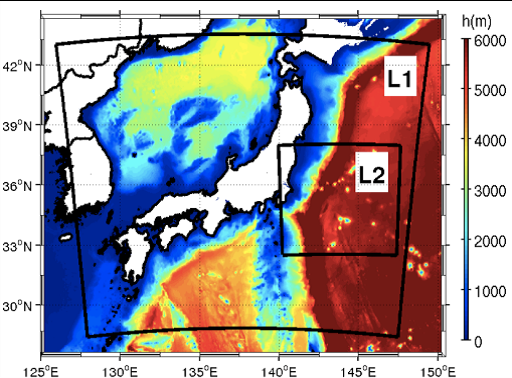
S3. High-resolution 3-dimensional hydrodynamic model
The local model, SUNTANS, will be nested into the regional model, ROMS(Figure 3). This combined hydrodynamic model will reproduce the Kuroshio path pattern and will include the biological models (from S1 and S2). Finally, this hydrodynamic-biological model will reproduce the dynamics of biodiversity in multi-scale at coastal area of Izu-Oshima.
S4. Biodiversity and environmental underwater monitoring system
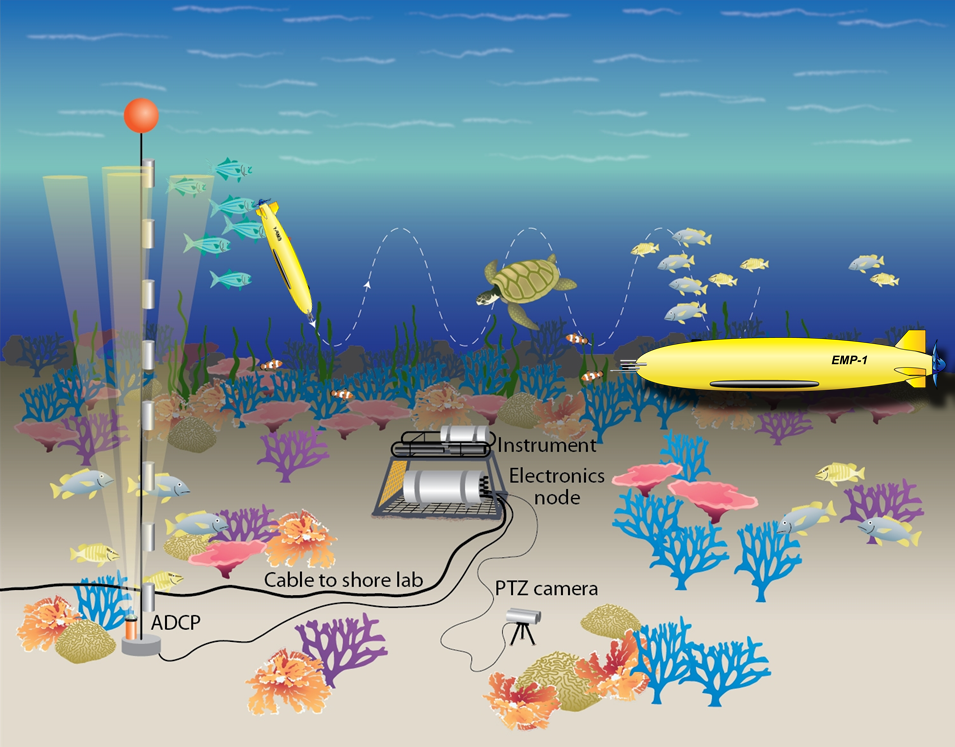
We will use a continuous monitoring system called Oshima Coastal Environmental data Acquisition Network System (OCEANS) to acquire biological and physical parameters at the coastal area of Izu-Oshima for the purpose of model improvements (Figure 4). This system is composed of a mooring system, a cabled observatory (CO), a PTZ camera and a marine ecosystem-microstructure monitoring platform (EMP).
Our system will have two plankton cameras mounted on the EMP and a cabled observatory.
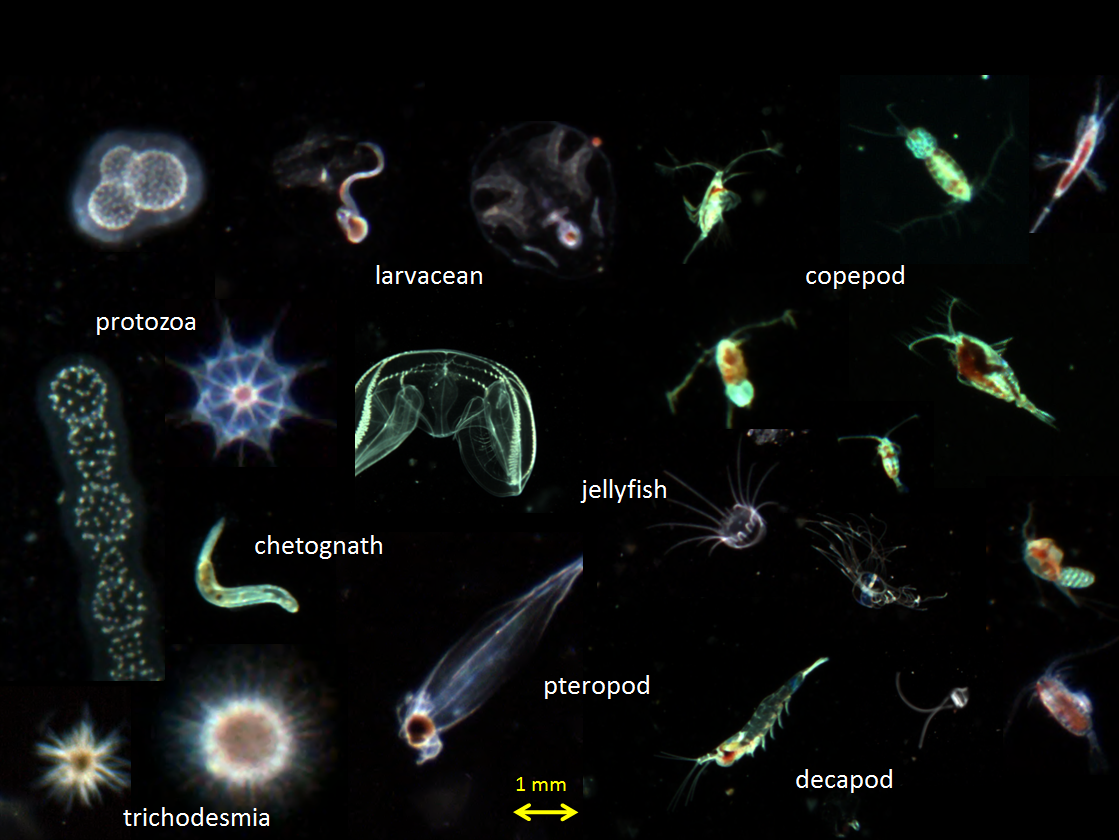
We will take pictures of planktonic organisms such as in Figure 5.
Detailed information about the underwater monitoring system is as follows:
Physical sensors
- Temperature- JFE Infinity CTW
- PME T-string
- Salinity- JFE Infinity CTW
- Water currents- Nortek ADCP
- Turbulence- Nortek ADV
- Optical Properties:
- PAR- JFE Compact ALW
- Turbidity- JFE Infinity CLW
- Pressure- JFE Infinity AWH
Biological sensors
- Phytoplankton- WHOI μCPICS (5 μm to 1 mm)
- Chlorophyll- JFE Infinity CLW
- Zooplankton- WHOI CPICS (200 μm to 2 cm), Nortek ADCP
- Fish- PTZ and WHOI stereo camera
- Marine mammals- sonar, hydrophone
Chemical sensors
- Nitrate- Satlantic SUNA
- O2- JFE RINCO W
Engineering
- Power monitor
- Fault detection
- Node status
- Switching sensors
S5. Prediction of biodiversity from S3
As stated above, S4 (the monitoring system) will be used to improve S1, S2 and S3 (the biological and hydrodynamic models).
Then, S1 and S2 (the biological models) will be incorporated into S3 (the hydrodynamic model) in order to accomplish S5 (the prediction of biodiversity).