GNUPLOT メモ 2010年05月31日(更新)
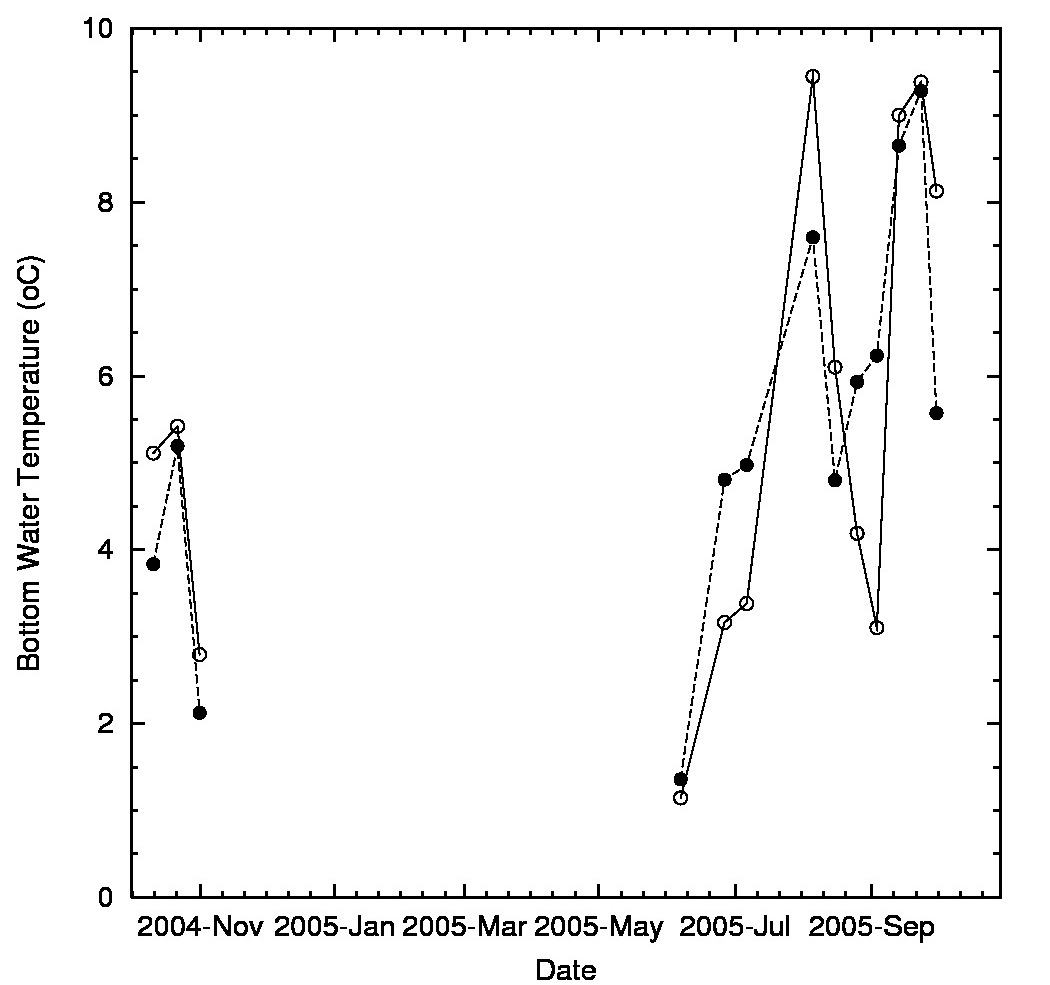
1.時系列グラフその1
#!/bin/tcsh
set y4=`date +"%Y"`
set ifl=mooring.vs.newmodel-BT-M01-04.txt
set gp=gp.pl
set fig1=Fig7.ps
set datet=`date +"%Y/%m/%d %H:%M"`
rm -fr $fig1
rm -fr $gp
awk '$1>=2004 && $1<2005 {printf "%4i%02i%02i %8.3f\n",$1,$4,$5,$6}' $ifl >! bt-2004
awk '$1>=2004 && $1<2005 {printf "%4i%02i%02i %8.3f\n",$1,$4,$5,$7}' $ifl >! bt-model-2004
awk '$1>=2005 {printf "%4i%02i%02i %8.3f\n",$1,$4,$5,$6}' $ifl >! bt-2005
awk '$1>=2005 {printf "%4i%02i%02i %8.3f\n",$1,$4,$5,$7}' $ifl >! bt-model-2005
cat << EOF >! $gp
set terminal postscript portrait #eps enhanced color solid
set output '$fig1'
set xdata time
set timefmt "%Y%m%d"
set format x "%Y-%b"
set yrange [0:10]
set xrange ["20041001":"20051030"]
set xlabel 'Date'
set ylabel "Bottom Water Temperature (oC)"
set nokey
set size ratio 1
set style line 1 lt 1 lw 1 pt 6
set style line 2 lt 2 lw 1 pt 7
set mytics 4
plot 'bt-2004' using 1:2 w lp ls 1 title "Barotropic velocity(cm/s)", \
'bt-model-2004' using 1:2 w lp ls 2, \
'bt-2005' using 1:2 w lp ls 1 title "Barotropic velocity(cm/s)", \
'bt-model-2005' using 1:2 w lp ls 2
EOF
gnuplot -persist $gp
ggv $fig1
exit
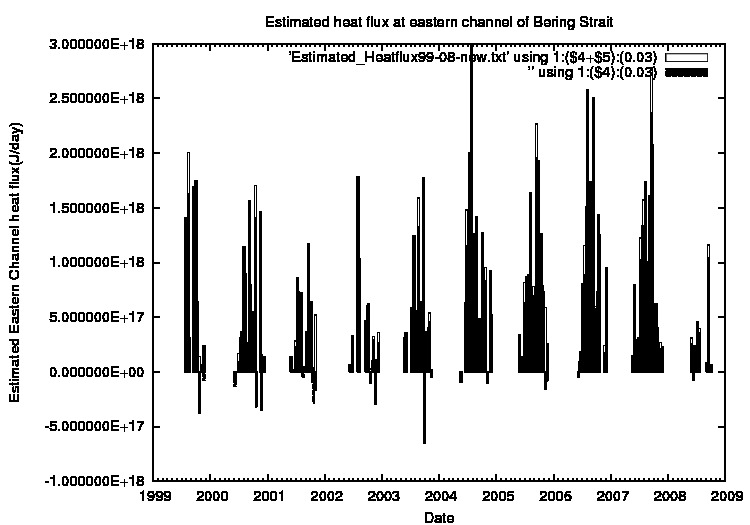
2.時系列グラフその2
#!/bin/tcsh
set ifl=Estimated_Heatflux99-08-new.txt
set fig1=Fig9.ps
awk '{print $1,$4,$5}' $ifl > tmp
#cat << EOF >! gp2
#set terminal postscript eps enhanced color solid
#set format y "%E"
#set output '$fig1'
#set xrange ["1999":"2009"]
#set title 'Estimated heat flux at Bering Strait'
#set xlabel 'Date'
#set ylabel 'Estimated Eastern Channel heat flux(J/day)'
#plot 'tmp' using 1:(4+5) with boxes lt 1,\
# '' using 1:(4) with boxes fs solid 10
#EOF
cat gp2
gnuplot -persist gp2
ggv $fig1
exit