Laboratory of Ocean Ecosystem Dynamics
日本語
Tokyo University of Marine Science and Technology

Azumi Furuyama (Master's Student)
M.S., Tokyo University of Marine Science and Technology, Graduate School of Marine Science and Technology, 2015
B.S., Tokyo University of Marine Science and Technology, 2013
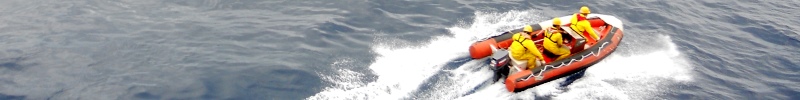
Infrared cameras can take pictures showing the temperature distribution of any material, including the surface of the sea. Using this feature, we conducted continuous observation of SST (Sea Surface Temperature) in the Kuroshio region. (The Kuroshio is a strong current in northwestern part of the Pacific Ocean along Japan.)
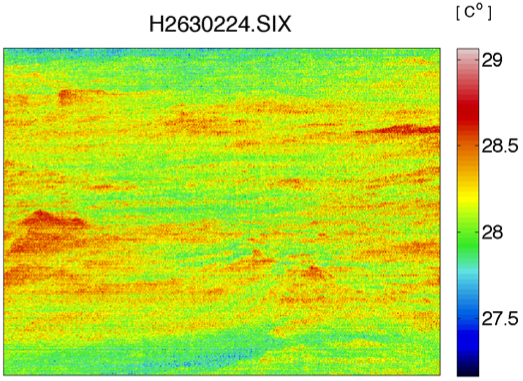
Fig. 1. An example of an infrared photo taken on an observation cruise in the Kuroshio region.
Fig. 1 is an example of an infrared photo taken on an observation cruise in the Kuroshio region. In this photo, we can see the spatial distribution of SST as well as the average temperature.
The usual method for conducting continuous observation of SST is using a conventional surface monitoring system attached to the ship, but this type of system cannot measure the true surface temperature, because the sensor is located under the water near the surface. Past studies have reported that there are temperature changes between the sea surface and a few tens of centimeters deep. An infrared camera can acquire the real temperature of the sea surface.
During this cruise, an infrared camera was fixed to the side of the ship at an angle, facing the sea surface, and took an infrared photo once every minute. The infrared images were converted to a 480x640 matrix and analyzed using MATLAB data processing software. However, infrared photos taken at a diagonally downward viewing angle are skewed; the temperature of closer areas appear to be higher than in reality, while temperatures in farther areas appear to be lower than in reality. To make sure that the infrared photo reflects the actual temperature, we determined the first-order linear approximation for the bias and corrected the infrared photo by subtracting the linear slope.
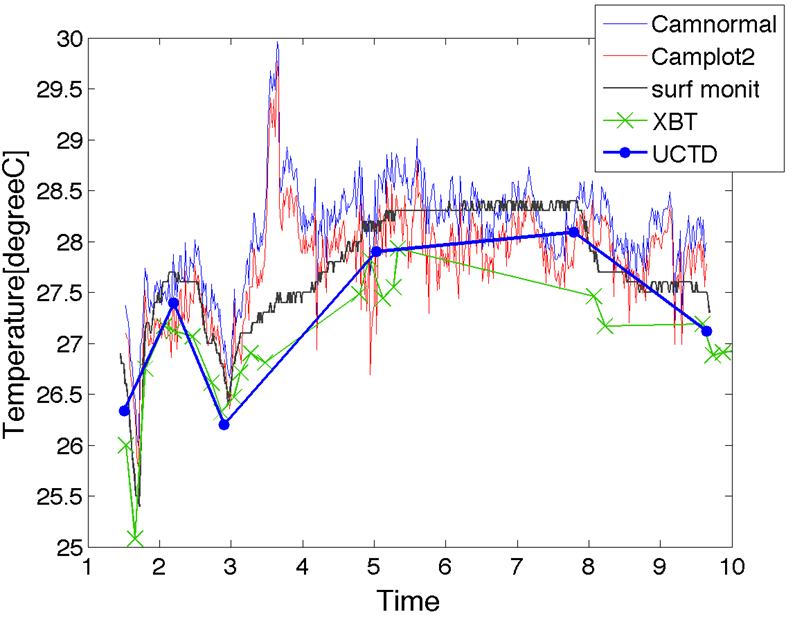
Fig. 2. The time series of the sea surface temperature around the Kuroshio region (142 degrees east longitude, 35.1-35.7 degrees north latitude), taken by infrared camera, the surface monitoring system attached to the ship and two free-falling profilers: Underway CTD and XBT.
Fig. 2 is the time series of the sea surface temperature around the Kuroshio region (142 degrees east longitude, 35.1-35.7 degrees north latitude), taken by infrared camera, the surface monitoring system attached to the ship and two free-falling profilers: Underway CTD and XBT. All the instruments show similar patterns of temperature distribution, but around the 3-4 hour, only the infrared camera was able to detect a rise in temperature. This hot water-mass, at about 1-2km wide, appeared at the edge of the Kuroshio Current. Since the other instruments could not capture this hot water-mass, the possibility exists that this phenomenon may be a thin layer spread across the water surface.
As the next step, we plan to observe the front between coastal water and pelagic water in the bay area from the sky by using an infrared camera attached to a balloon. This information will be combined with high-resolution observation data from the YODA profiler (Yoing Ocean Data Acquisition profiler).
In conclusion, infrared cameras are able to acquire detailed micro-distribution of temperature, so they can also be used in rotating tank experiments and the observation of turbulent microstructure as well as for a myriad of other applications.